Overall Equipment Effectiveness (OEE) is often thought of as a metric that only the big players monitor. Most small and mid-size Canadian plants either don’t track OEE at all, or if they do, it rarely changes how the plant operates day to day.
Managers may see a percentage on a dashboard, but it rarely tells them which machine to fix, which changeover to streamline, or where to focus maintenance effort first.
OEE only becomes valuable when it acts like an objective scoreboard – an agreed upon, trusted measure that tells your team which piece of equipment is holding back the entire system, and what to do about it. This blog will focus on that practical side of OEE for small and mid-size Canadian manufacturers with a mix of legacy equipment, manual processes, and limited engineering bandwidth.
Why OEE Matters in Manufacturing Operations
Overall Equipment Effectiveness (OEE) measures how much of your planned production time is converted into good parts at the ideal cycle time. It tells you how much of your scheduled production time turned into good parts, at the right speed, and how much was lost to downtime, slow running, or quality issues.
For Canadian SMEs, that “lost time” is usually where the hidden factory lives – capacity you already own but can’t see or trust. With proper OEE monitoring you have a credible scoreboard, that:
- Shows which machine has the greatest opportunity for improvement on a line.
- Links equipment performance directly to throughput and on‑time delivery.
- Provides maintenance and operations teams with clear, objective targets instead of anecdotal complaints.
In most plants, improving OEE at the true bottleneck process adds far more output than spreading effort across every machine. – Daniel Hill, Program Manager Manufacturing
Most plants already track “some numbers” on the floor – units per shift, scrap, downtime, and changeovers, but struggle to turn those metrics into clear marching orders for their teams. Within a broader smart manufacturing operating model used by modern Canadian manufacturers, OEE helps translate machine data into practical operational decisions for plant managers.
OEE does this by connecting a few simple questions directly to throughput:
- How much of the scheduled time was the machine running versus down (operating time vs. downtime duration)?
- When it was running, did it run at the ideal cycle time and output rate expected from that machine?
- Of what it produced, how much was good product that flowed through without rework or scrap?
Instead of treating these as separate metrics, OEE ties them directly to the performance of the system’s bottleneck or pacemaker process – the machine that sets the pace for the entire production line.
When you track OEE at that pacemaker, you’re effectively measuring how much of your true capacity is being converted into saleable output, and how much is leaking away in hidden losses.
This is where your OEE implementation strategy begins. It is far more useful than a standalone KPI on a dashboard. It creates operational visibility into:
- Lost uptime from breakdowns, minor stops, and long changeovers.
- Lost performance from running below the planned cycle time.
- Lost quality from defects and rework that quietly consume capacity.
Because each of these loss buckets is structured and measurable, OEE for production and manufacturing is a practical measurement system that points directly to improvement work: maintenance on a chronically unreliable bottleneck machine, SMED (Single-Minute Exchange of Die) projects on a pacemaker with long changeovers, or quality fixes where first pass yield is throttling throughput.
Used this way, OEE is less about “What’s our score this month?” and more about “Which specific losses are holding back our line, and what do we fix first to move more good product out the door?”
Understanding the OEE Formula (Availability × Performance × Quality)
The first step in understanding OEE is to define the plan. For example, how many hours per shift should the machine run, and what its realistic speed and quality. If this is not determined from the outset, your OEE numbers are not an accurate or useful representation.
Enginuity’s Dan Hill Program Manager, Manufacturing Development has seen this firsthand, “In factories there’s a thing called wallpaper… you want to make everything look cool for the managing director, so you post numbers on the wall, but is it the truth? – If not, it’s just wallpaper.”
OEE combines three dimensions of equipment performance:
- Availability – How much of the planned production time the machine was actually running.
- Performance – How fast it ran compared to its ideal (nameplate) cycle time.
- Quality – How many of the units produced were good on the first pass (often referred to as “first-pass yield”).
However, Dan Hill emphasises an important nuance: every OEE component really has planned and actual. “An OEE number is really six numbers – uptime planned and uptime actual, speed planned and speed actual, quality planned and quality actual.” These 6 metrics will offer optimal OEE values for effective production.
A useful way to think about OEE is every component requires two numbers: planned and actual.
- Planned availability vs. actual availability.
- Planned speed (or performance) vs. actual speed.
- Planned quality vs. actual quality
Calculating OEE for a single machine
Shift length: 480 minutes
Downtime: 60 minutes
Actual output: 840 units
Ideal output: 1000 units
Defective units: 40
Planned production time = 480 minutes
Run time = 480 – 60 = 420 minutes
Availability = 420 / 480 = 0.875 (87.5%)
Ideal speed = 1000 units / 480 min = 2.083 units/min
Actual speed = 840 units / 420 min = 2.0 units/min
Performance = 2.0 / 2.083 ≈ 0.96 (96%)
Good units = 840 – 40 = 800
Quality = 800 / 840 ≈ 0.95 (95%)
OEE = 0.875 × 0.96 × 0.95 ≈ 0.80 (80%)

On paper, 80% looks “pretty good”, but if the “planned” speed was never realistic, or if downtime was hand logged and missed micro stops, that 80% may be materially overstated. Furthermore, this is an optimistic look of one machine in your line. Add multiple machines to measure the OEE against others to see what needs improving.
The Six Production Losses That Reduce OEE
Most manufacturing plants can calculate OEE, but struggle to answer the more important question: where exactly are the losses happening on the production floor? The Six Big Losses framework translates OEE’s three components (availability, performance, and quality) into specific operational problems engineers can fix on real equipment.
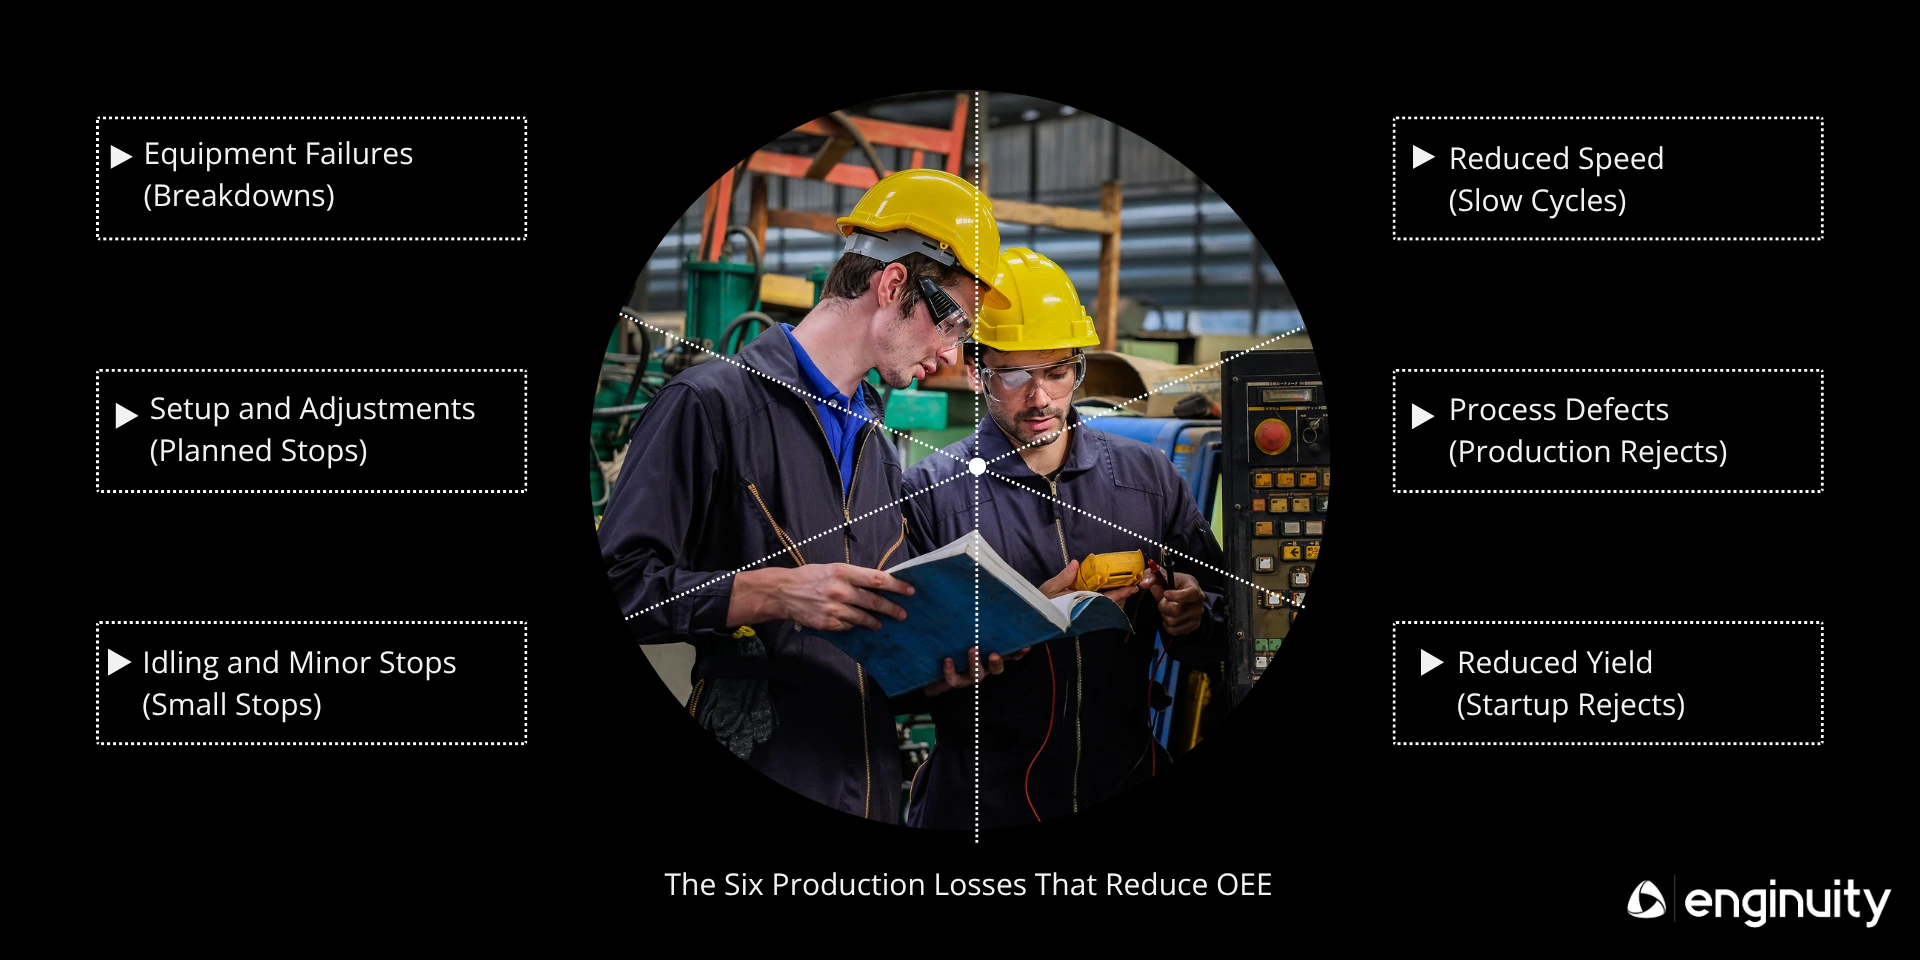
The Six Big Losses line up like this:
- Breakdowns – unplanned equipment failures that stop production, such as a seized motor on an injection molding press or a failed conveyor drive in a packaging line.
- Minor stops – short interruptions that frequently go unrecorded but accumulate significant lost production time, such as bottle jams on a packaging line or parts sticking in a mold.
- Reduced speed – equipment running below its designed cycle time or nameplate capacity, often due to worn tooling, unstable materials, or cautious operator settings.
- Changeovers and setups – planned downtime required to switch tools, molds, materials, or product formats, such as swapping molds on an injection molding machine or changing bottle sizes and labels on a packaging line.
- Scrap – defective parts that must be discarded because they do not meet quality specifications, such as short shots in injection molding or dimensional defects in machining.
- Rework – products that require additional processing before they meet quality standards, such as trimming flash from molded parts or correcting packaging errors.
Breakdowns, minor stops, and changeovers affect equipment availability. Reduced speed impacts performance, while scrap and rework reduce first-pass quality yield. You don’t need a complex system to start using this framework; even a basic tally of how often each of these happens on your bottleneck machine will tell you where to direct problem solving; maintenance, setup reduction (e.g., SMED), or operator training.
By categorizing losses this way, OEE becomes more than a percentage. It becomes a structured diagnostic tool for identifying hidden production losses across a manufacturing system.
How OEE Losses Appear in Different Manufacturing Processes
Injection Molding Line
- Breakdowns: hydraulic failure on the molding press
- Minor stops: parts sticking in the mold
- Changeovers: mold swaps between product SKUs
- Reduced speed: slower cycle time due to cooling limitations
- Scrap: short shots or warped parts
- Rework: trimming flash or secondary finishing
These losses directly reduce equipment availability, cycle time performance, and first-pass yield on the molding press.
Packaging Line
- Breakdowns: conveyor motor failure
- Minor stops: bottle jams or label misalignment
- Changeovers: switching bottle sizes or packaging formats
- Reduced speed: operators slowing machine to prevent jams
- Scrap: damaged packaging materials
- Rework: repackaging damaged units
In high-speed packaging environments, even small micro-stops can significantly reduce throughput across the entire production line.
Why OEE Often Becomes Misleading in Small Manufacturing Plants
Poor data collection, inconsistent downtime definitions, and manual logging bias often produce inflated OEE numbers that hide real production losses. These numbers look great on the wall but don’t reflect reality. This is common in factories where:
- Operators hand record downtime and performance on paper.
- Reason codes are inconsistent or applied casually.
- Legacy machines aren’t instrumented, so “best guesses” fill in the gaps.
- Dashboards are designed to impress visiting executives, not to drive improvement.
For example, one aerospace facility had OEE dashboards showing numbers in the 90%+ range – but local engineers openly admitted they weren’t true. The numbers were tuned to meet expectations, not to drive root cause analysis.
The result is false confidence:
- Maintenance teams stay in firefighting mode because they don’t trust the metrics.
- Operators see the gap between what’s on the wall and what’s happening on the floor and disengage.
- Leadership assumes the capital expenditure is paying off (e.g., “we bought an 85% OEE machine”), when actual availability, speed, or quality is much lower.
- If OEE is not built on objective machine signals and clear definitions of planned vs. actual, it quickly becomes another misleading KPI.
How OEE Monitoring Systems and Dashboards Improve Visibility
The turning point in most plants is the move from manual logging to automated signals. In practice, that usually means:
- Tapping existing machine I/O signals from PLCs or controllers for run/stop signals and cycle counts.
- Adding simple sensors (e.g., current/voltage, proximity, photo eyes) on older machines.
- Feeding these signals into an OEE monitoring platform, SCADA/HMI system, or PLC-based automation architecture allows manufacturers to visualize machine performance in real time and identify downtime patterns across the production line.
Implementing a basic MES (Manufacturing Execution System) is more accessible than many people think. It is not that hard for the uptime and performance, because most machines have data outputs you can get.
Even if they’re old, it’s not hard to add sensors. For most machines, two out of the three signals come from the machine automatically. The third [quality] needs to come from internal measurement.
An effective OEE dashboard for a Canadian SME doesn’t need to start as a full MES. At minimum, it should:
- Show real-time run/stop status for each key machine.
- Display current OEE (or at least availability) versus plan for the shift.
- Let supervisors drill into top downtime reasons and speed losses.
- Highlight the constraint machine (bottleneck / pacemaker) and its current state.
This is where the distinction between monitoring and leadership is made. OEE monitoring is management using the dashboard, then seeing the OEE results and saying, ‘We need to set a new goal for that machine’. This is paramount for continuous improvement.
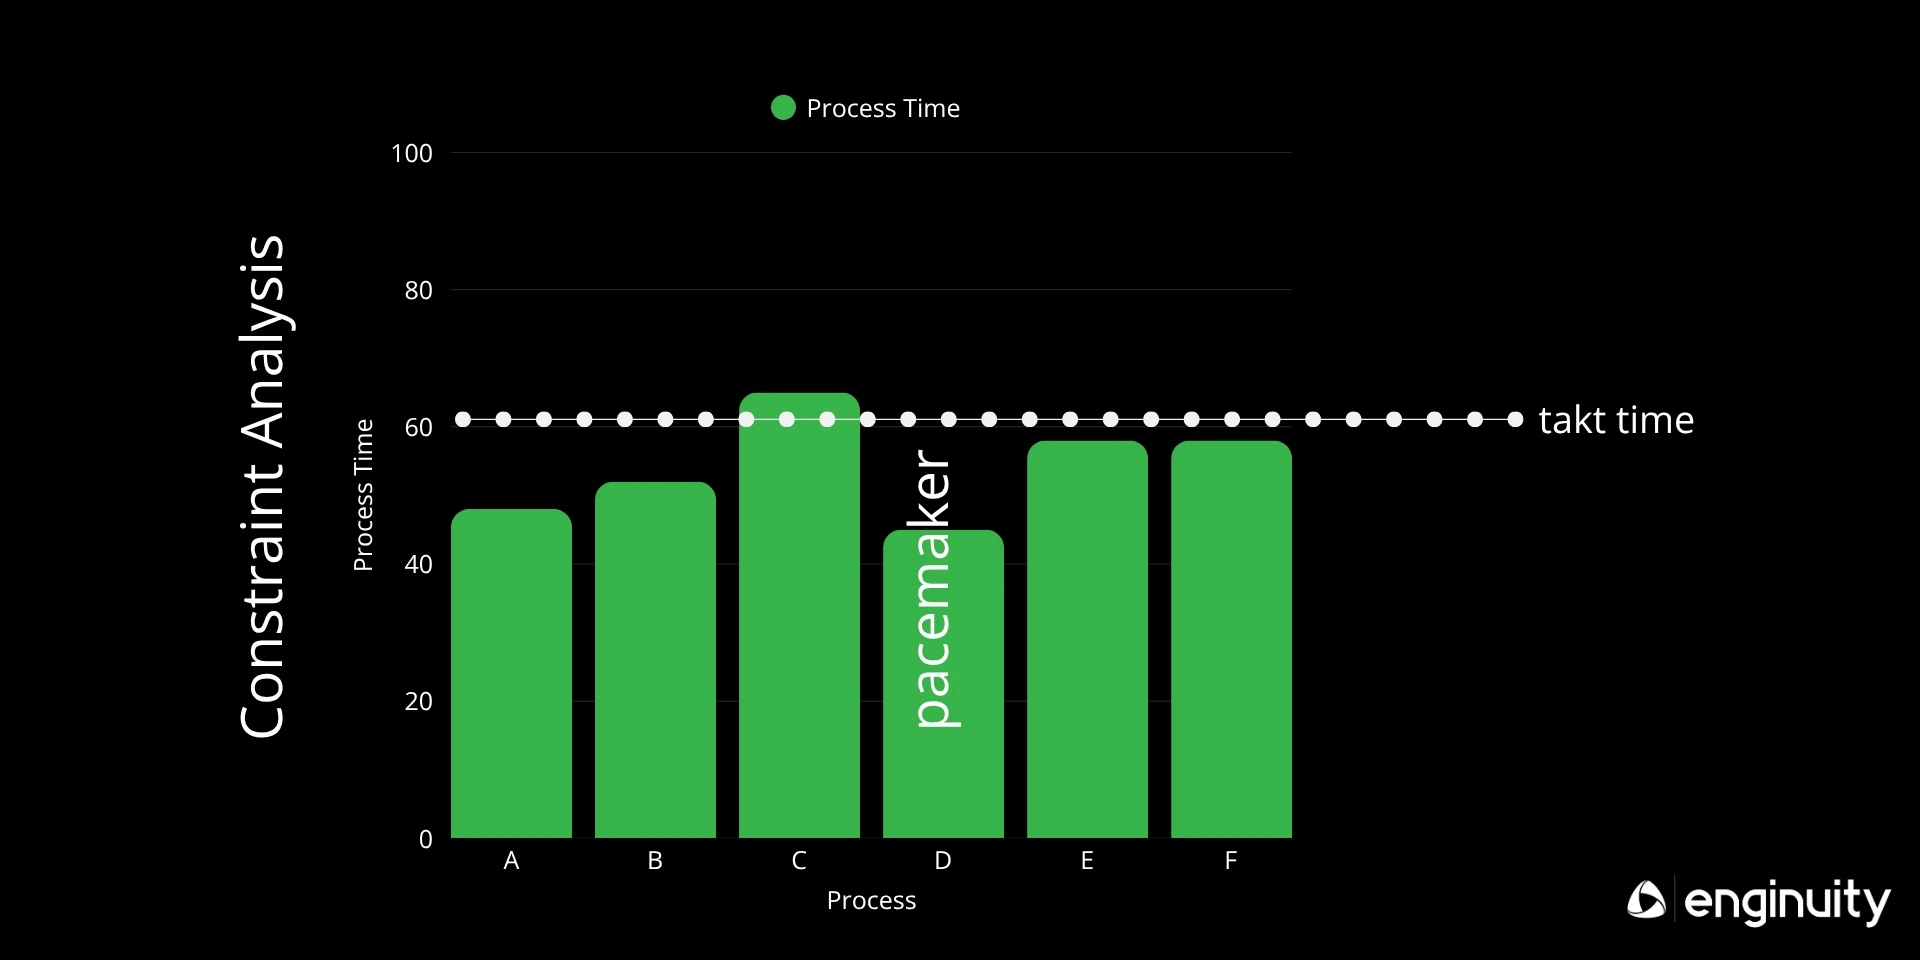
Constraint Analysis – Identifying Bottlenecks
OEE becomes powerful when combined with constraint analysis – understanding where your system’s true bottleneck (or pacemaker) is.
The goal is to have all process operating under takt time, aka – the rate of customer demand.
Think of a simple line with six machines in sequence: A, B, C, D, E, F. If six machines are all running below takt time and you know the process time of machine C is too high, that is the constraint. So then that’s where you need to set a higher OEE goal. Raising OEE on A, B, D, E, or F won’t increase total throughput; all work is still limited by inefficiency of machine C.
Note: These different terms; bottleneck, constraint, pacemaker – describe the same reality. Pacemaker is an alternate name for the bottleneck or constraint. It is the machine that sets the pace for the rest of the factory.
In practice:
- The bottleneck/pacemaker sets the maximum achievable throughput.
- OEE on that process is ‘the only OEE one really that matters’ for system capacity.
This is where value stream mapping and industrial engineering analysis help identify where production flow breaks down and where improvement efforts should focus first.
Map your main product family, note the cycle times and WIP buildups at each step, then overlay OEE data. The station where WIP piles up and OEE is low is your best candidate for focused improvement.
The OEE Illusion: High OEE vs. Actual Output
A common mistake in manufacturing analytics is evaluating OEE percentages without considering actual production output. A useful thought experiment to keep teams honest is the OEE Illusion:
| Line | OEE | Output per shift |
| Line A | 85% | 400 units |
| Line B | 65% | 800 units |
Which line is better?
OEE alone would suggest Line A is “world class.” But if your business cares about shipped units, Line B is clearly delivering more value – even with a lower OEE score. This is a reminder that OEE is the means of identifying hidden production losses, not an award for the highest percentage.
This is why tying OEE back to throughput, takt time, and customer demand is essential. For a constraint process, the goal is not a pretty percentage; it’s meeting or exceeding takt consistently.
Practical Strategies to Improve OEE in Manufacturing
Once you’ve identified your pacemaker machine and have credible data, improving OEE becomes a structured problem-solving exercise rather than guesswork. Here are practical levers that act as a roadmap:
- Start with uptime (availability) only
A practical starting point is uptime/downtime. It doesn’t have to be a fancy dashboard. It can literally just be green light, red light, and time. If you’re early in the journey, focus first on a simple run/stop timeline for the constraint machine and compare planned vs. actual hours. - Align maintenance with operations goals
In many older companies, maintenance teams work at a distance from operations – and usually they’re firefighting. Using OEE and uptime metrics gives the maintenance team a clear, shared target with production (for example improving availability on Machine 3 from 50% to 65%). In many plants, solving recurring downtime issues may require automation upgrades to machine control systems or even custom equipment modifications designed specifically for the production process. - Apply SMED and changeover reduction
Changeovers sit squarely in the availability bucket. SMED (Single Minute Exchange of Die) is a classic approach for cutting changeovers from hours to minutes. Stage tools and fixtures ahead of time instead of while the machine is down. - Address speed losses logically
Sometimes quality issues (like overheating spindles or worn tooling) force operators to slow the machine. A quality issue may actually inform the speed of the machine – you might deliberately trade speed for stability until you can address the root cause. - Use TPM (Total Productive Maintenance) practices
TPM focuses on how you make the system more productive and what maintenance you need to get there. Combining preventive and predictive maintenance on the constraint equipment boosts MTBF (Mean Time Between Failures) and reduces MTTR (Mean Time to Repair), directly improving OEE where it matters most.
The common thread is that every action is grounded in measured, trusted data. It’s one thing to say ‘go from 50% OEE to 85,’ but with real data you can say, “If we bump up availability by 10%, here’s what we get.’”
Linking OEE Improvements to Profitability
From a financial perspective, OEE gains at the bottleneck directly influence:
- Throughput (units shipped per week/month) – More revenue from the same fixed assets.
- Unit cost – Overhead spread across more good units, especially when scrap/rework falls.
- Capital efficiency – Better utilization of existing machines before buying new ones.
Capital expenditure decisions are often justified on optimistic performance assumptions. Without accurate OEE, you can’t know whether you’re getting the return on capital you planned.
On the other hand, with objective OEE and uptime data, management can see that “we had two hours on Tuesday that we should have been running, but we weren’t – your job is to find out why not. It’s just the truth.” That truth is what justifies investments in fixtures, tooling, sensors, controls, or new machines.
A Practical OEE Implementation Roadmap for Canadian Manufacturers
Many Canadian SMEs delay getting serious about OEE because full “Industry 4.0” modernisation looks overwhelming. But it doesn’t have to be.
A realistic, low risk roadmap looks like this:
- Phase 1 – Manual uptime logging on the bottleneck
Start with a single pacemaker machine and record when it should be running vs. when it is. These are baby steps towards OEE, but let’s start with that, because that’ll get you a long way. - Phase 2 – Sensor-based counting and run/stop
Add basic sensors to legacy equipment or tap existing outputs to capture run/stop and part counts automatically – it’s not as complicated as it seems. - Phase 3 – PLC / SCADA integration
Connect machine signals into PLC control systems, SCADA monitoring platforms, or edge data devices to centralize production data and capture downtime reason codes digitally. - Phase 4 – OEE dashboard
Implement an OEE dashboard that shows real-time status and historical trends for your key machines and highlights the bottleneck machine and its current performance against targets. - Phase 5 – Predictive optimisation
Once data is stable, explore predictive models for maintenance, changeovers, and scheduling, using OEE trends to support capital planning and debottlenecking projects.
At each phase, you should be able to answer a progressively more powerful set of questions, starting from “Is the pacemaker running when it should?” to “Are we getting the quality we promised when we bought it?” If you can’t yet answer those questions objectively, you don’t need a full MES, you need a focused OEE implementation on one constraint line.