Most automation content lists technologies. This guide doesn't. The plants that get automation right start with process clarity, not gear selection, and build in stages instead of leapfrogging straight to AI. Here's the sequence Canadian SMEs should actually follow, and why most of the ROI is lost in the first decision.
- Plants that map their bottlenecks before buying technology hit payback 30 to 40 percent faster than peers who lead with gear selection.
- PLCs and sensors come first. SCADA, IIoT, machine vision, and AI all sit on top of that foundation, not beside it.
- Most Canadian SMEs should not start with AI or robots. They should start with data capture and process visibility, then scale once the floor is stable.
Business is tough at the best of times. Canadian manufacturers are under constant pressure to improve throughput, reduce labour dependence, strengthen quality, and stay competitive in a market shaped by reshoring, labour shortages, and rising input costs.
If you’re thinking about adding automation in your plant, the first question isn’t “What technology should we buy?” It’s “What process problem are we actually trying to solve?” Most automation content lists technologies. This guide gives you the sequence, meaning what to automate first, what to add next, and what to hold off on until your plant is ready.
For more than 20 years, Enginuity Inc., has helped plants across Canada (and beyond) take a practical, process-first approach to industrial automation.
This blog helps plant managers, operations leaders, and manufacturing engineers avoid expensive missteps and build a stronger automation roadmap. We’ll walk you through identifying bottlenecks, prioritising high-ROI opportunities, building the right foundation with PLCs and sensors, adding visibility with HMI and SCADA, and scaling into IIoT and advanced automation, but only when your plant is ready.
What to Know Before You Start (The “Secret” First Step)
One of the most common mistakes in manufacturing automation is jumping into technology before understanding the process. Plant managers and operators often buy sensors, software, or advanced systems because they seem modern, or because they solve one small visible issue. Then they discover the real constraint sits somewhere else in the production flow. The bottleneck doesn’t disappear. It just shifts.
That’s why the first step is always process clarity. Before buying technology, manufacturers need to understand where value is created, where time is lost, and which constraints are limiting output. Without that foundation, automation can simply move the bottleneck rather than remove it. The Theory of Constraints (Eliyahu Goldratt’s framework for identifying what actually limits throughput) has documented this pattern in manufacturing plants for over 40 years.
At Enginuity Inc., we see this often in Canadian plants with legacy equipment and growing production demands. This is also why we take a practical, process-first approach to smart manufacturing rather than chase the latest technology trend. In 20+ years of automation work, the pattern is consistent. Plants that skip process clarity end up with misaligned investment and equipment that runs beautifully but doesn’t move the business forward. The ones that start with process mapping hit payback 30 to 40% faster than peers who lead with technology selection.
Step 1: Understanding Your Process Before Automating Anything
The first step is mapping your current production process from raw material to finished goods using Value Stream Mapping (VSM). This reveals bottlenecks, cycle time gaps, waiting time, manual intervention, and rework loops. These are the real constraints limiting output. Only after you understand where value is created and where time is lost should you evaluate technology. Skipping this step is the single most common reason automation projects fail to deliver ROI.
Process mapping reveals the gap between what teams think is happening and what’s actually happening on the floor. It also helps identify the kinds of tasks most suitable for robotic integration and other forms of automation.
Below is a classic example of VSM, a way of visualising production flow and an essential tool for identifying a production line’s challenges along with the improvement opportunities they create.
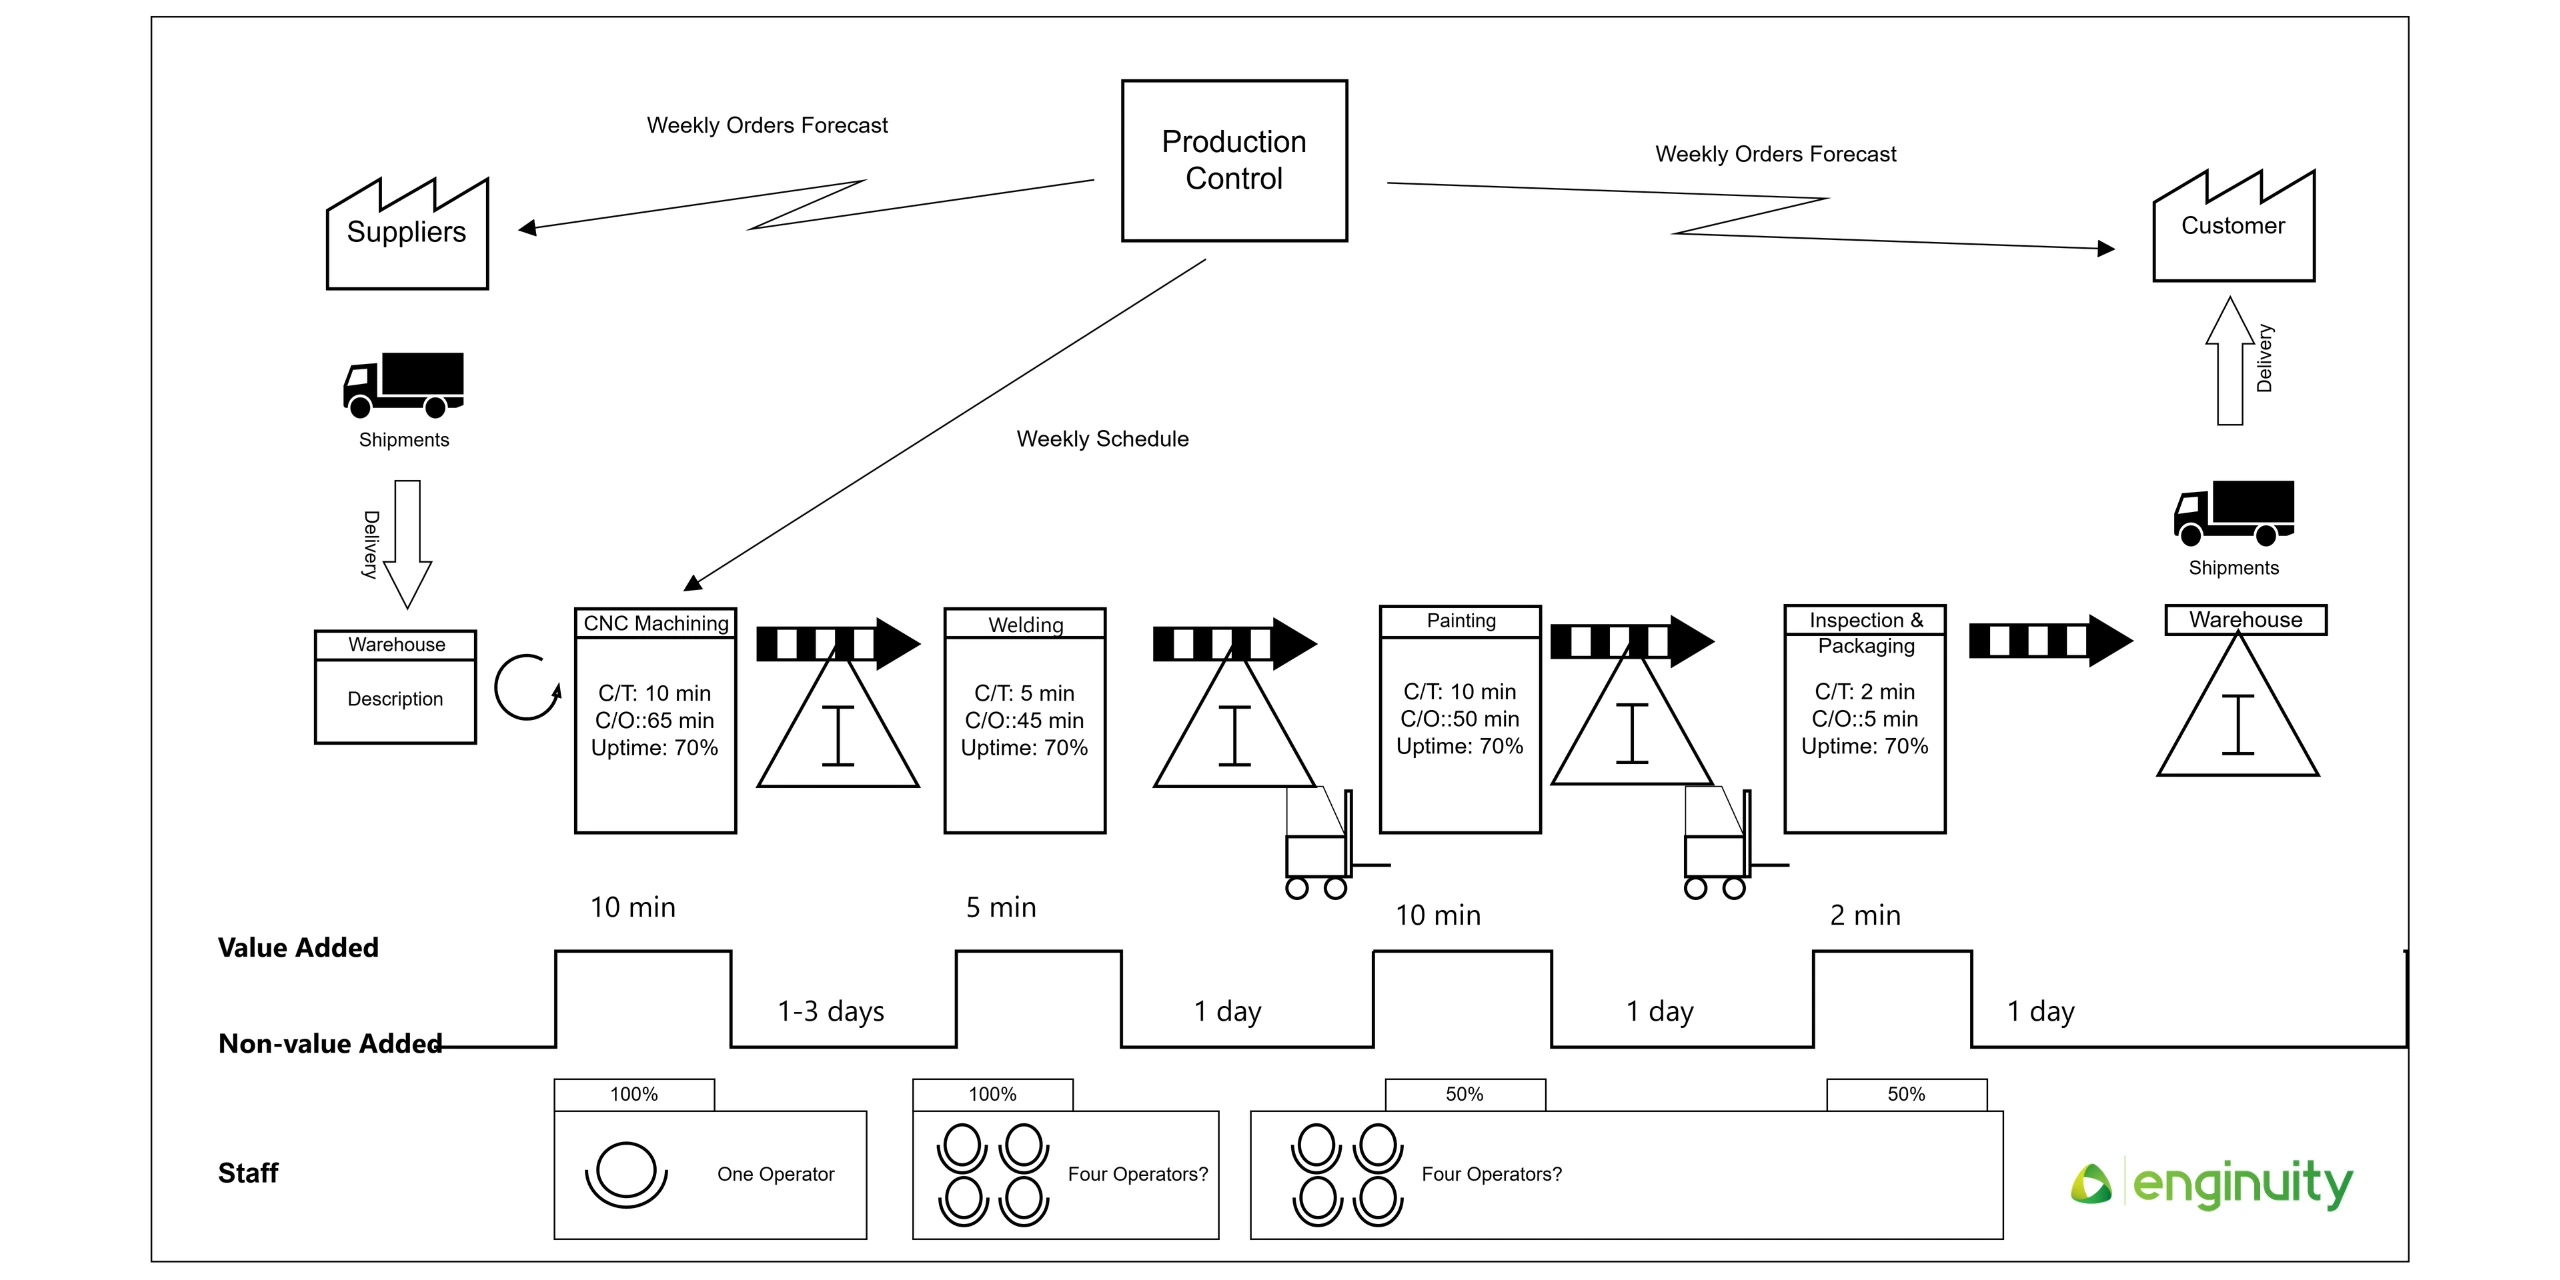
Value Stream Mapping (VSM) – a way of visualising production flow and an essential tool that identities your production line’s challenges and thus opportunities for improvement.
Identifying “4D” Tasks
One of the easiest starting points for automation is the set of tasks that are dull, dirty, dangerous, or difficult. These jobs create the most strain on operators, drive the highest WCB insurance premiums, and offer the clearest opportunity for improvement.
Examples include packaging, material handling, and inspection. These are strong starting points, but they should still be selected based on manufacturing strategy, not just because they look repetitive. A task being repetitive doesn’t automatically make it the right first target.
Once identified, the mitigation path becomes obvious. A robotic cell to reduce repetitious, monotonous actions? A machine guarding solution to eliminate operator danger? A simple palletiser to handle the physically difficult task of loading? Each addresses a different “D” and carries a different cost, complexity, and payback profile.
The Issues Operators Deal with That Never Make It to Reports
A lot of the real problems in a plant don’t show up neatly in a KPI dashboard. Operators see them first: the packaging line that jams every Tuesday afternoon when humidity rises, the forklift route that forces a detour around a pillar, the upstream conveyor that dumps product faster than the downstream station can handle on Mondays after weekend cleaning.
These disruptions rarely reach management reports in their raw form. By the time they become a number, they’ve been averaged, abstracted, and stripped of the context that tells you what to actually fix.
That’s why operator input matters. It uncovers daily disruptions, hidden constraints, failure patterns, inventory mismatches, and labour gaps that aggregated numbers miss. Operator input captures the practical reality of the shop floor, and it’s often the single richest source of automation targets in the entire plant.
Step 2: Identifying High-ROI Automation Opportunities
High-Impact Areas to Start
Not every task deserves automation first. The best early wins have clear labour savings, ergonomic benefits, and quality improvement, ideally all three in the same project.
Common high-impact areas include palletizing and packaging, machine tending, material handling, and quality inspection. Each recovers FTE (Full-Time Equivalent, the 40-hour-per-week labour unit used in manufacturing ROI calculations) capacity while improving consistency.
Palletizing and packaging can free up 1 to 2 FTEs per shift, as we’ve seen in food packaging automation projects across Atlantic Canada. Material handling reduces ergonomic strain, cuts WCB exposure, and improves flow. Quality inspection improves yield and reduces scrap, rework, and customer complaints. Win, win, win.
ROI Framework
A basic PLC retrofit typically runs $15,000 to $50,000 CAD. SCADA integration for a multi-machine line usually lands between $50,000 and $200,000 CAD. Full IIoT deployments across multiple lines or sites can exceed $500,000 CAD.
Canadian government programs, including CME SMART Advanced Manufacturing, NRC IRAP (National Research Council Industrial Research Assistance Program), and provincial productivity grants, can offset up to 30% of eligible hardware costs, which materially shortens payback.
A practical ROI model starts with task frequency, labour cost, error impact, and downtime impact. Labour cost is often expressed through FTE, which makes it easier to estimate the value of freed-up labour across shifts.
Error impact should include scrap, rework, and product yield. If automation improves Rolled Throughput Yield (RTY, the percentage of units that move through the entire process without defects or rework) or reduces quality losses, it also protects sales. Consistent, reliable product keeps customer complaints down and repeat orders up.
A practical ROI framework should look at:
- task frequency
- labour cost (expressed in FTE)
- error impact (scrap, rework, product yield, RTY)
- downtime impact (MTBF and MTTR, meaning how often equipment fails and how long it takes to get running again)
- revenue protection through quality improvement
Many Canadian manufacturers see the fastest gains here. The goal is to automate the right thing first.
ROI Calculation Example
Let’s take a demo example. “ABC Food Co.,” a mid-sized food processor in Atlantic Canada, upgrades an older packaging line with a basic PLC retrofit costing $30,000 CAD. The new system reduces downtime by 10%, saves 8 hours of manual adjustments weekly, and cuts scrap material by 5%. Annual efficiency gains land around $20,000 CAD in combined labour and material savings.
- Initial cost: $30,000 CAD
- Eligible grant offset (30%): up to $9,000 CAD
- Net investment: $21,000 CAD
- Annual return: $20,000 CAD savings
- Payback period: roughly 1.05 years (12 to 13 months)
- Five-year ROI: over 375%
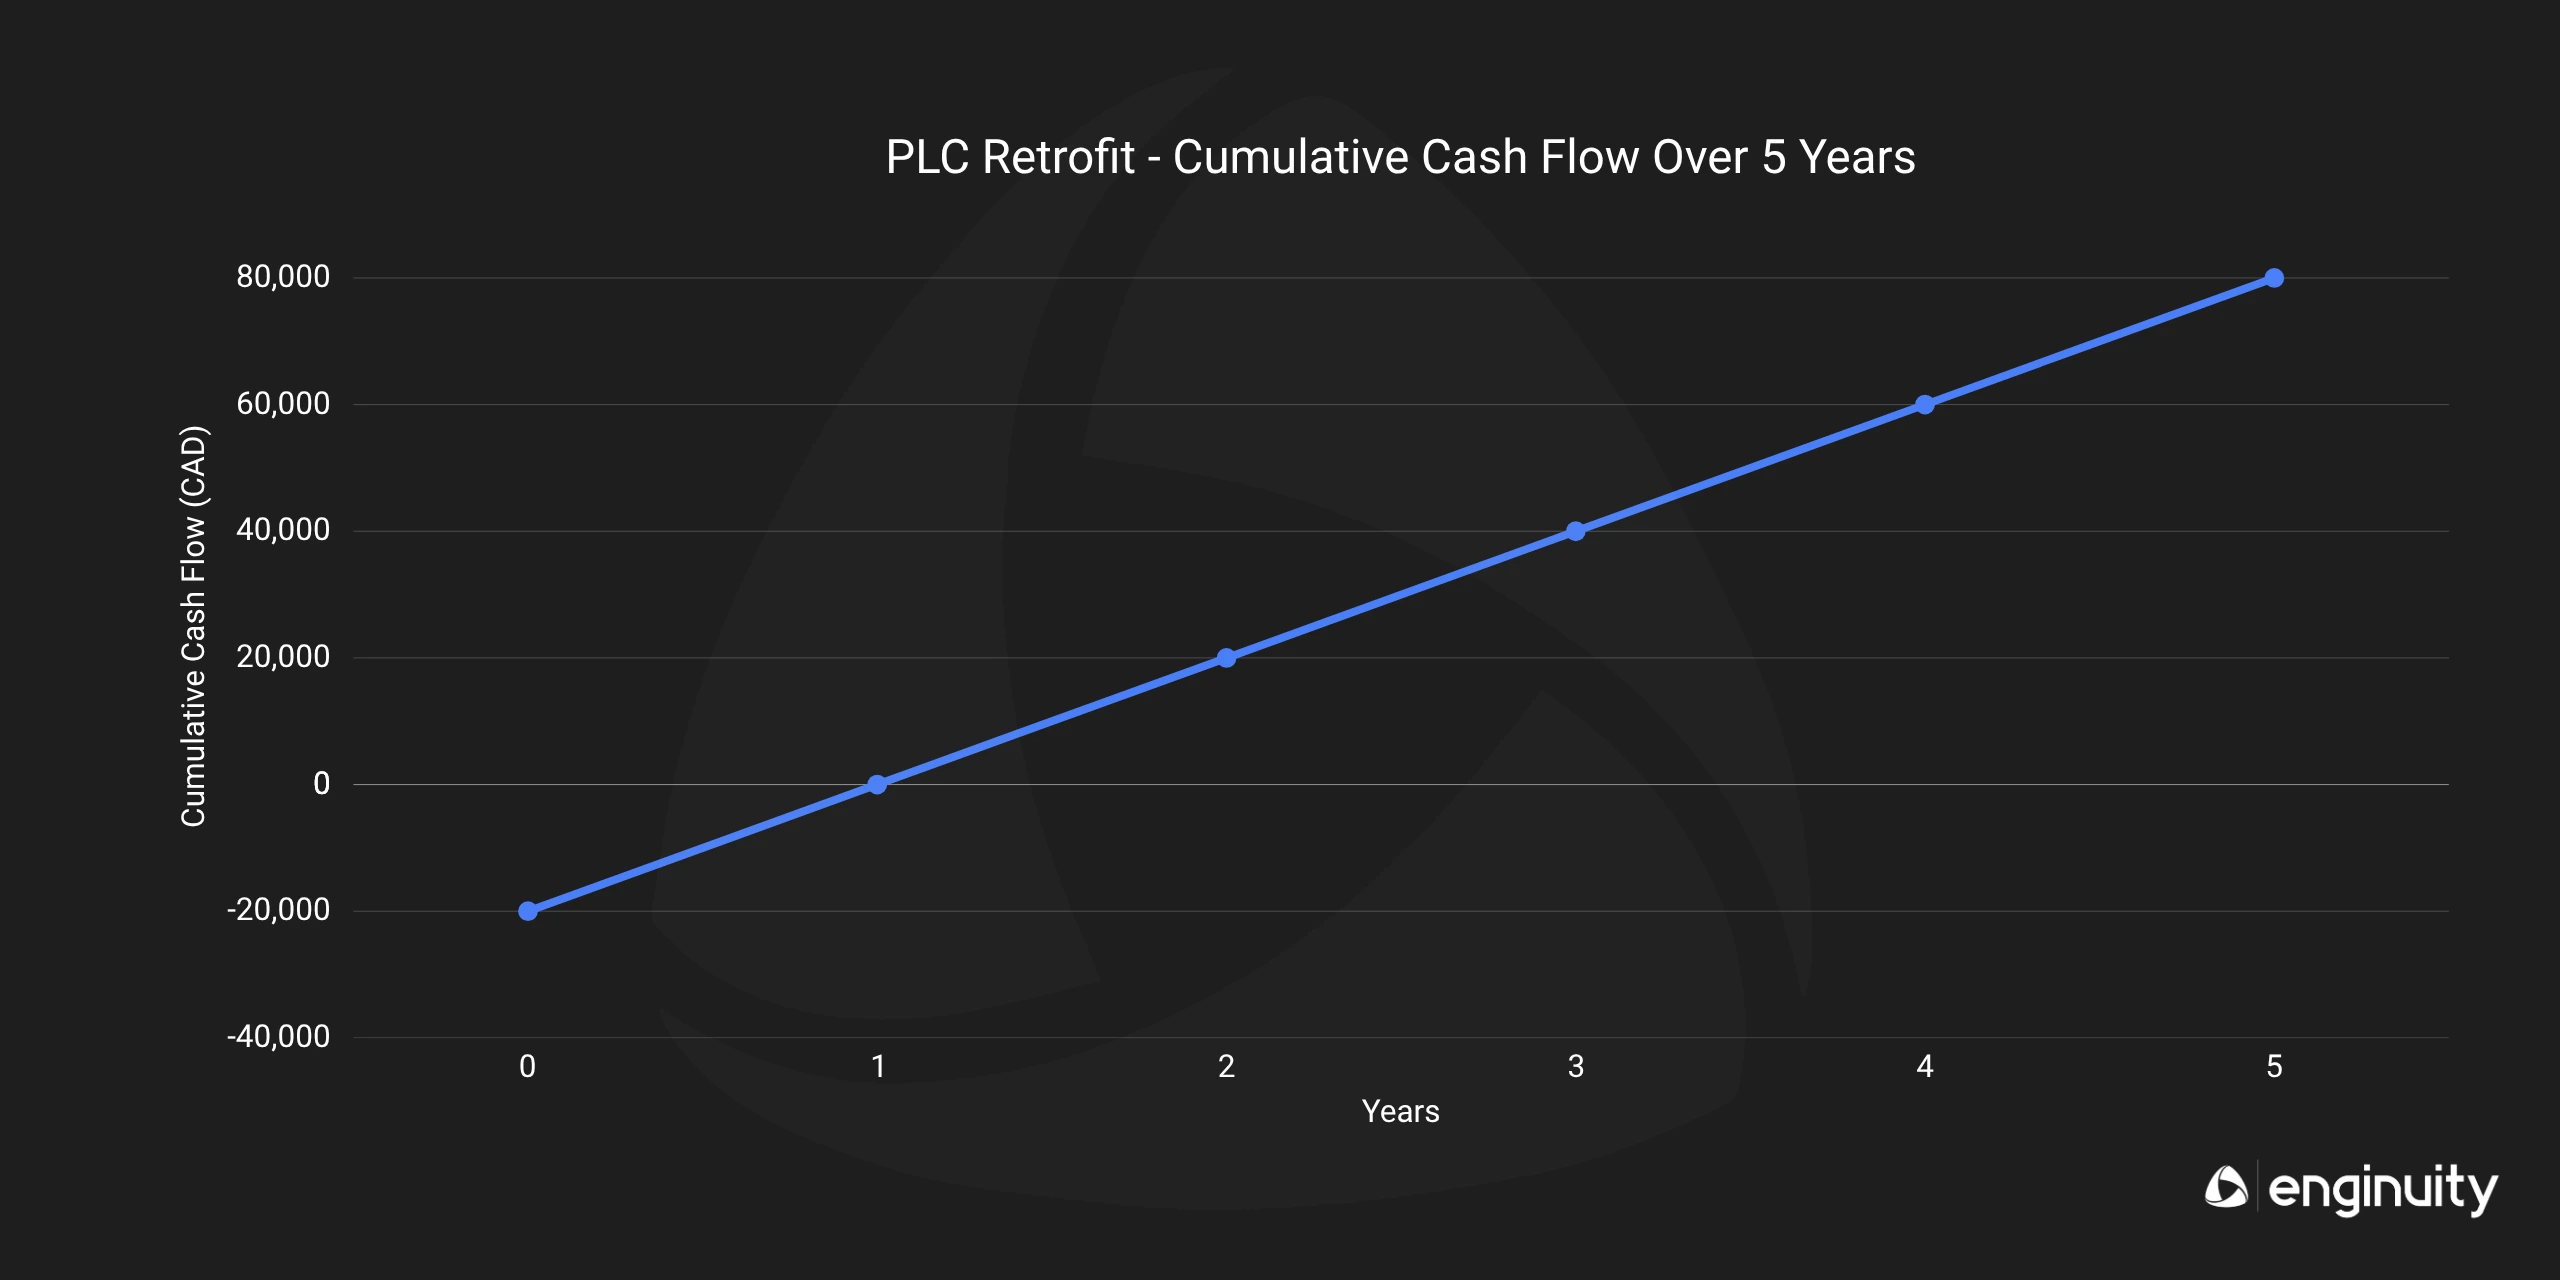
ROI Calculation in the context of PLC Retrofit
Here’s what’s happening in the graph above:
- Year 0 starts at negative $21,000 CAD, reflecting the net investment after the 30% grant offset.
- Each year adds $20,000 CAD in efficiency savings (labour plus materials).
- The line crosses $0 just after Year 1, visually confirming the ~1.05 year payback.
- By Year 5, cumulative benefit reaches roughly $79,000 CAD, supporting a 5-year ROI well above 375%.
Typical payback periods in Canadian plants: PLC retrofits recover their cost in 12 to 18 months, HMI and SCADA integrations in 18 to 24 months, and full IIoT deployments in 2 to 3 years depending on scale. Machine vision systems for quality inspection often pay back in under 12 months because scrap, rework, and customer returns drop sharply once inspection is automated.
For a larger facility adding SCADA integration at $125,000 CAD, the system might streamline quality assurance, energy monitoring, and predictive maintenance, yielding $55,000 to $75,000 CAD in yearly savings. When federal or provincial grants contribute up to $37,500 CAD, an ROI within 2 years is typical.
Full IIoT deployments exceeding $500,000 CAD often achieve scalable benefits like cross-site analytics and real-time machine intelligence. These high-end transformations target 20 to 40% productivity boosts, with ROI horizons of 3 to 5 years, depending on adoption maturity and data utilisation.
Common Mistakes to Avoid
Plants often make the mistake of automating unstable processes too early. Others ignore changeovers, skip operator input, or overengineer a solution before proving value on a simpler version.
The goal is to find quick wins with manageable complexity. If a project is too complex for the problem it solves, the payback suffers even if the technology itself works flawlessly.
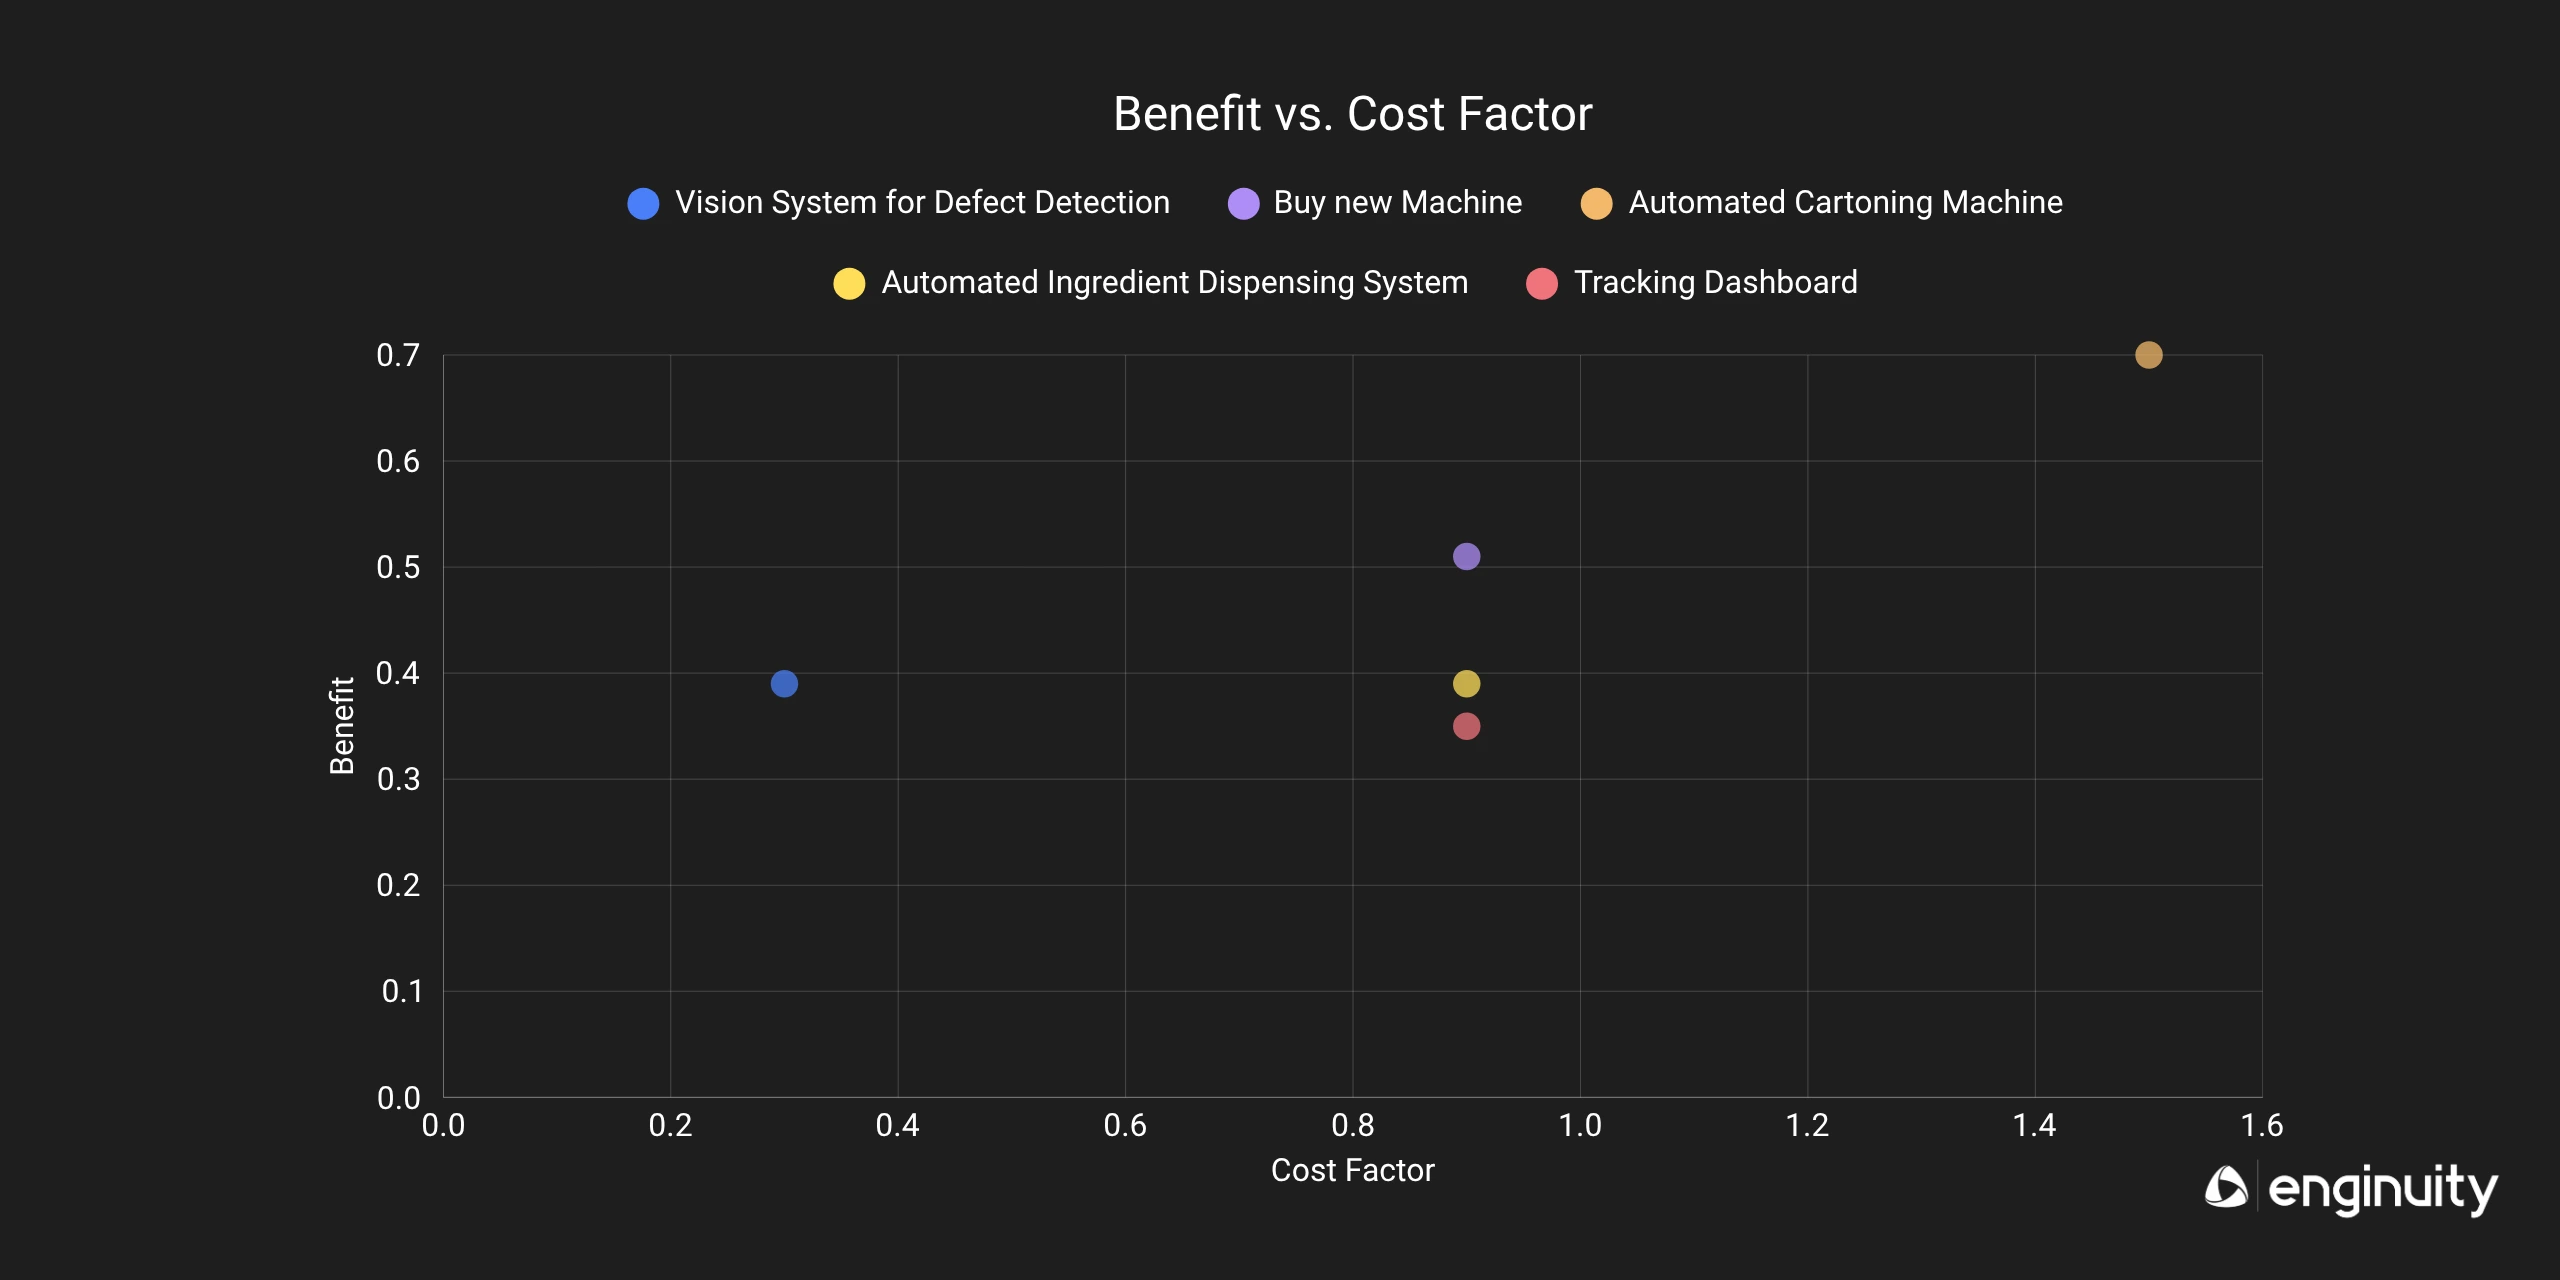
ROI vs Complexity Matrix
Step 3: Starting with Basic Automation
Why a PLC Comes First
A plant shouldn’t jump straight to IIoT without a proper control layer. PLCs (Programmable Logic Controllers, the industrial computers that run machine logic) are the foundation because they handle machine-level control and create deterministic behaviour. Same inputs produce the same outputs, every cycle, every time.
That reliability matters. A PLC makes decisions identically on cycle 1 and cycle 1,000,000, which is exactly what you want when repeatability, safety interlocks, and uptime are non-negotiable. Everything you eventually do at the SCADA and IIoT layers depends on a stable, deterministic control layer underneath. Skip the PLC foundation, and your dashboards will beautifully visualise chaos.
Role of Sensors
Sensors connected to PLCs provide the inputs that make automation useful. Common industrial sensors include proximity sensors (detect whether something is there), photoelectric sensors (detect light beam breaks), vibration sensors, temperature and pressure transducers, and load cells (measure weight or force). They count production, detect whether a machine is running or stopped, identify faults, jams, and misfeeds, and feed that data upstream for decision-making.
On their own, sensors don’t solve anything. They’re inputs, not actions. They become valuable when they feed a controller (the PLC) that can act on the information, and eventually feed a supervisory layer (SCADA) that makes the data visible to humans.
What You Gain at This Stage
At this stage, the plant gains more consistent operation, basic data capture, and less manual intervention. With sensors and a PLC in place, you now have a Continuous Monitoring System, with multiple parameters tracked in real time. That gives you the first honest picture of what your equipment is actually doing across every shift. That data becomes the raw material for every decision from Step 4 onward.
Step 4: Adding Visibility with HMI and SCADA Systems
HMI for Operator-Level Visibility
An HMI (Human-Machine Interface, typically a touchscreen panel mounted near the equipment) gives operators a direct interface to the machine. It displays alarms, allows operators to adjust basic recipe or setpoint values, and enables manual overrides when the process requires human judgement.
A well-designed HMI reduces the expertise gap between control engineers and production staff, which is exactly what plants need when skilled labour is scarce. It helps operators respond to issues without digging into PLC code or calling engineering support for every small setpoint change.
SCADA for System-Level Visibility
SCADA (Supervisory Control and Data Acquisition, the software layer that monitors and coordinates multiple PLCs at once) gives a plant broader, centralized monitoring. It tracks downtime across multiple machines, aggregates alarms, and presents OEE dashboards and production KPIs at a system level. The view is no longer one machine at a time.
This matters when visibility needs to move beyond one operator station. Management, technicians, and maintenance supervisors can all see the bigger picture and react faster. That means catching a trending fault before it becomes a shutdown, or spotting a line-level pattern (Mondays, third shift, specific products) that one operator would never see alone.
PLC vs. SCADA: What’s the Difference?
A PLC controls an individual machine. It’s the doer, executing logic deterministically to keep equipment running the same way every cycle. SCADA is the watcher. It collects data from multiple PLCs and gives you a plant-wide view of performance, alarms, and downtime. PLCs come first. SCADA only makes sense once you have PLCs and sensors generating trustworthy data to supervise.
When SCADA Actually Makes Sense
SCADA makes the most sense when a plant has multiple machines generating data, recurring downtime issues that need root cause analysis, or a genuine need for centralized visibility across lines. It becomes especially valuable when management wants to understand performance patterns across the floor, shift over shift, product over product, line over line, rather than staring at one isolated machine and hoping the rest is fine.
Step 5: Connecting the Plant with IIoT and the Data Layer
What IIoT Actually Does
IIoT (Industrial Internet of Things, meaning connected sensors and machines that stream data to analytics platforms) is not the starting point. That’s why it’s Step 5 in our roadmap, not Step 1. It’s a scaling layer that becomes useful after control and visibility already exist.
IIoT becomes valuable once a plant already has a control layer (PLCs and sensors) and a visibility layer (HMI and SCADA) in place. At that point, connectivity aggregates data across machines, lines, or sites and makes it available for remote monitoring, edge analytics, and cloud-based analysis.
This is especially useful for manufacturers that need cross-line analytics, predictive maintenance, or better reporting across multiple facilities. Ontario automotive tier-2 suppliers, Quebec pharmaceutical packaging lines, and Alberta oil and gas processing plants have all leveraged IIoT at this stage to tie together data from multiple sites.
When to Introduce IIoT
IIoT makes the most sense when a plant is ready to scale across multiple lines or sites, when management needs better access to live performance data, or when diagnostic information has to move faster than manual reporting and weekly meetings allow.
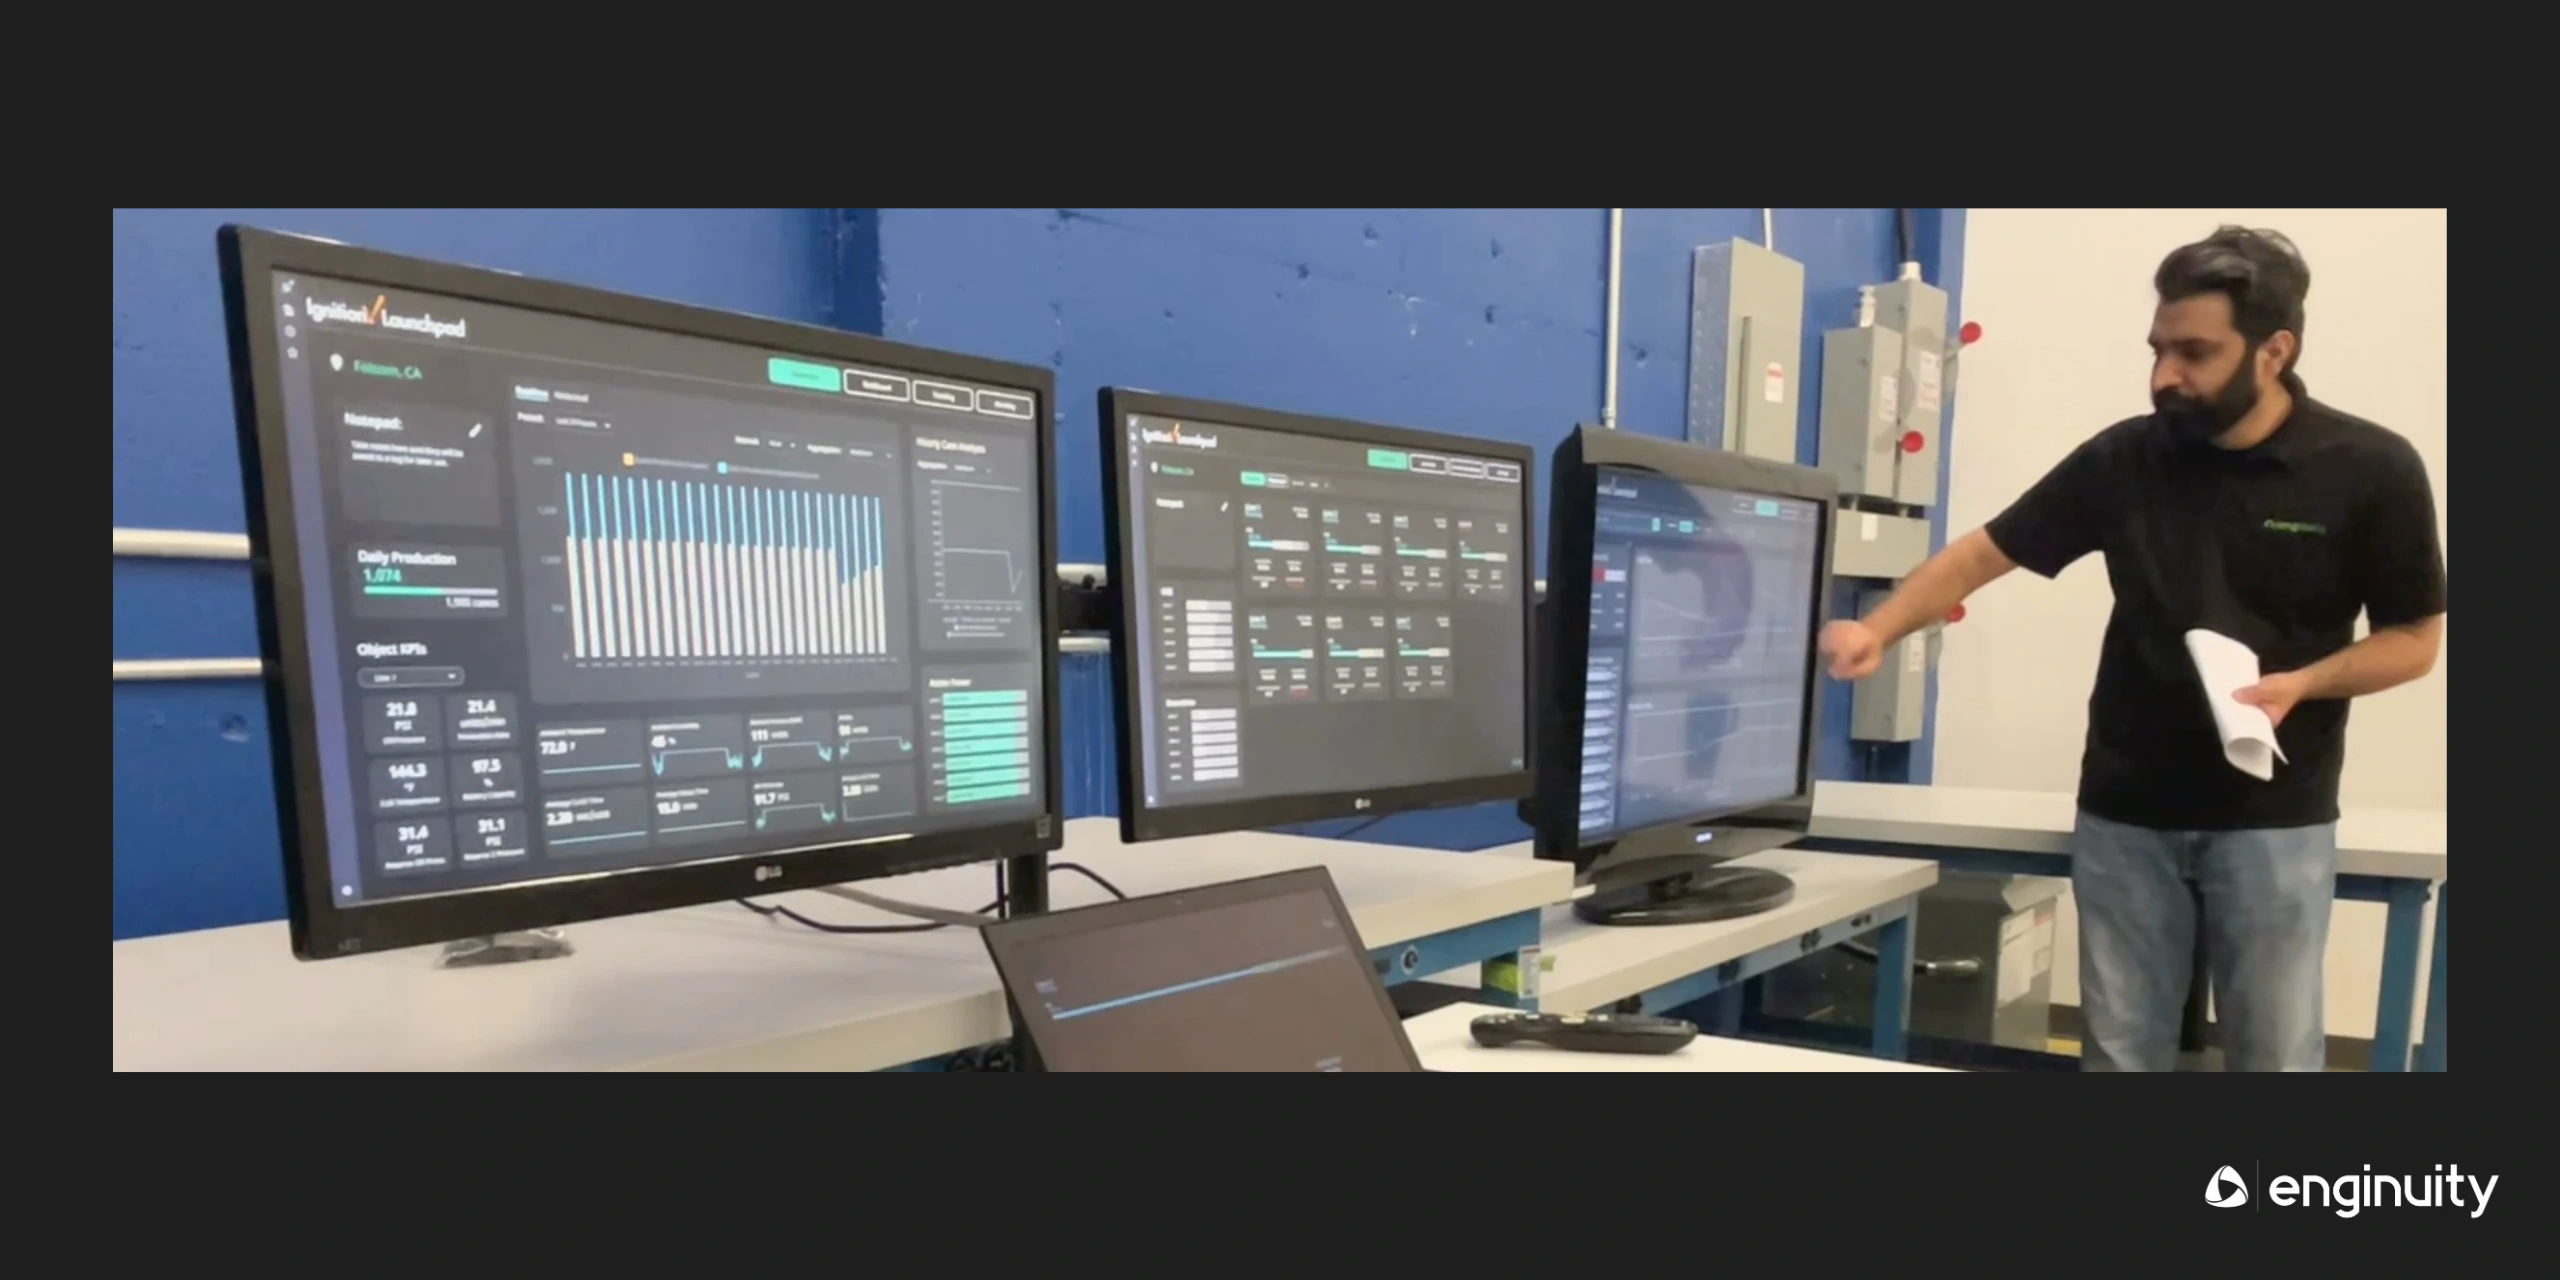
Enginuity A&R EIT Seinan Khan monitoring multiple parameters, an OEE Dashboard and KPIs, across many machines at once, remotely using Ignition™ .
Use Cases for IIoT
Strong IIoT use cases include predictive maintenance (using vibration, temperature, and current signatures to forecast bearing wear or motor failure before breakdown), cross-line analytics, and remote diagnostics. These applications work best when the underlying data is trustworthy and the process is stable enough to interpret it properly. Noise in, noise out.
Step 6: Advanced Automation (Machine Vision, Optimization, and AI)
Machine Vision for Quality
Machine vision works well for defect detection, packaging validation, label verification, and barcode or OCR (Optical Character Recognition) reading at line speed. It’s especially useful when visual inspection is repetitive, time-sensitive, or inconsistent when done manually. This is common in food packaging, pharmaceutical labelling, and electronics assembly.
A vision system can inspect at line speed across a full shift without fatigue, which is something no human workforce can sustain. The result: better quality, higher throughput, and less burden on operators.
AI and Predictive Systems
AI and predictive systems are useful when the plant has enough data, process consistency, and a clearly defined operational problem. These systems can forecast equipment failures, optimise setpoints and energy use, and identify patterns across months of operating data that humans would never spot manually.
Introduce them only when the process is stable. If the underlying operation is still changing constantly (from undocumented manual tweaks, inconsistent changeovers, or drifting sensor calibration), advanced analytics produce noise instead of insight. AI doesn’t fix an unstable process. It amplifies whatever is underneath it.
When It Actually Works
Advanced automation works best when three conditions are in place: a stable process, consistent data, and clearly defined quality standards (ideally tied to a CAPA, meaning Corrective and Preventive Action, and continuous improvement system). Without those, the technology may be impressive in demos but delivers disappointing ROI in production.
Conclusion: A Practical Automation Roadmap
A phased roadmap beats a big-bang transformation almost every time. Most Canadian plants get better results by building capability in stages instead of jumping directly to the most advanced technology. The ones that try to leapfrog usually end up retrofitting the foundations they skipped.
The Five Phases:
- Phase 1: Manual tracking. Know what you do today before automating it.
- Phase 2: Sensors and PLC. Establish deterministic control and basic data capture.
- Phase 3: HMI and SCADA. Make the data visible and actionable.
- Phase 4: IIoT integration. Connect across lines and sites for aggregated intelligence.
- Phase 5: Machine vision, AI, and optimisation. Apply advanced systems on top of a stable foundation.
This phased approach reduces risk and helps the plant build capability over time. Each investment supports the next instead of creating disconnected systems that are difficult to scale or integrate later.
For Canadian manufacturers facing legacy equipment, labour shortages, or shifting production demands from reshoring and supply-chain realignment, this roadmap matters more than ever. The goal isn’t to automate everything at once. The goal is to build the right foundation and scale intelligently.
Start With One Bottleneck
We model labour savings, throughput gains, scrap reduction and operating costs to determine realistic payback before any capital commitment.


